Exercises
Contents
Exercises
If you ever get really stuck on an exercise, skip it and ask for help!
Exercise 1 - Plotting
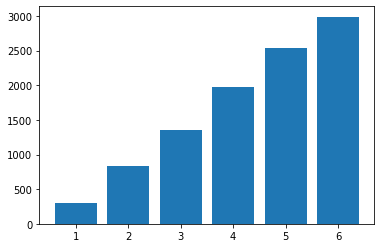
a) Simulate 10000 throws of two dice, and record the highest of the two dice in a list.
Plot the frequency of the numbers 1 through 6
What is the probability of rolling a maximum of 1?
What is the probability of rolling a maxiumum of 6?
import matplotlib.pyplot as plt
from random import randint

diceThrows = []
ones = 0
sixes = 0

i = 0
while i < 10000:
    dice1 = randint(1,6)
    dice2 = randint(1,6)
    if dice1 > dice2:
        if dice1 == 1:
            ones = ones + 1
        if dice1 == 6:
            sixes = sixes + 1
        diceThrows.append(dice1)
    else:
        if dice2 == 1:
            ones = ones + 1
        if dice2 == 6:
            sixes = sixes + 1
        diceThrows.append(dice2)

    i = i + 1

print("Probability of rolling a maximum of 1 is", ones/10000)
print("Probability of rolling a maximum of 6 is", sixes/10000)

plt.hist(diceThrows, bins=range(1,8), align="left", rwidth=0.8)
plt.show()
Probability of rolling a maximum of 1 is 0.0296
Probability of rolling a maximum of 6 is 0.299
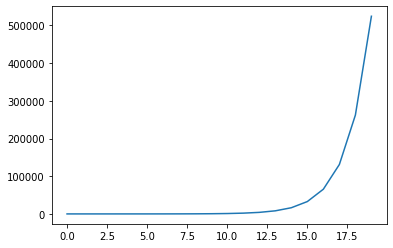
b) Create a list with elements [1, 2, 4, 8, 16, ...], each element being double the last, with 20 elements. Plot the growth of the elements in the list.
doubling = []

for i in range(20):
    doubling.append(2**i)

plt.plot(doubling)
plt.show()
Exercise 2 - Correlation
Lawmakers have noticed that high ice cream sales are correlated with large numbers of crime in a given week. Here is a list containing the total ice cream sales in the same weeks as the dataset for crime.
iceCreamSales = [7.9, 12.6, 15.9, 18.0, 30.6, 24.2, 11.1, 28.9, 21.4, 11.0, 30.4, 20.1, 13.2, 34.7, 9.3, 32.4, 32.6, 25.4, 22.0, 24.0, 19.1, 13.1, 32.3, 25.7, 31.4, 20.7, 27.0, 15.3, 16.8, 31.1, 27.2, 38.2, 13.5, 24.2, 26.2, 31.1, 23.3, 16.4, 11.0, 15.2, 31.1, 15.8, 24.9, 18.8, 21.0, 13.3, 26.9, 25.4, 35.0, 22.0, 19.9, 33.0, 24.0, 29.7, 32.6, 13.2, 41.3, 14.1, 22.6, 14.5, 28.0, 16.3, 32.9, 12.6, 32.6, 32.0, 27.4, 31.0, 32.8, 27.4, 14.8, 26.4, 11.7, 10.7, 17.1, 26.1, 11.5, 12.8, 34.9, 32.4, 35.0, 31.4, 8.7, 31.8, 21.9, 24.1, 19.2, 7.5, 35.0, 23.4, 14.3, 27.4, 28.3, 11.5, 13.0, 30.5, 12.1, 32.7, 24.5, 30.0, 22.2, 33.8, 35.1, 29.5, 12.9, 15.5, 26.0, 14.1, 30.6, 17.7, 29.6, 5.0, 38.0, 20.1, 14.1, 23.1, 10.6, 7.0, 27.5, 17.3, 19.9, 30.8, 39.2, 32.7, 17.9, 10.5, 22.2, 39.6, 29.4, 22.1, 16.3, 25.1, 13.4, 23.3, 11.2, 12.1, 10.1, 8.6, 19.2, 33.4, 28.6, 16.8, 6.1, 27.5, 32.1, 14.3, 38.5, 23.2, 22.2, 7.9, 20.3, 41.5, 35.5, 11.9, 29.0, 16.2, 27.3, 21.0, 6.5, 10.7, 7.9, 29.2, 22.4, 30.8, 15.1, 30.8, 15.3, 21.8, 41.1, 31.5, 22.9, 20.1, 21.7, 21.3, 27.9, 28.8, 30.5, 11.3, 18.7, 34.1, 23.2, 23.8, 28.7, 28.2, 30.8, 29.1, 18.8, 30.5, 10.8, 19.3, 12.7, 33.1, 28.4, 29.5, 32.5, 34.7, 25.8, 30.5, 22.2, 17.4, 23.9, 7.5, 13.0, 44.7, 21.1, 27.2, 13.7, 23.4, 23.3, 32.5, 7.8, 35.4, 18.0, 36.7, 23.3, 13.6, 7.4, 8.7, 8.1, 39.2, 24.1, 12.8, 18.3, 19.7, 35.6, 19.2, 12.3, 34.1, 30.7, 13.6, 29.1, 9.4, 30.0, 15.5, 40.4, 33.6, 18.5, 21.3, 21.4, 37.2, 29.4, 16.1, 28.1, 38.1, 7.4, 38.2, 22.6, 15.4, 6.9, 10.1, 14.1, 17.7, 20.8, 15.7, 13.2, 19.4, 20.8, 35.2, 9.4, 22.8]
crimes = [31, 35, 49, 69, 103, 94, 46, 91, 68, 40, 98, 74, 40, 114, 48, 103, 88, 81, 65, 82, 64, 51, 91, 80, 90, 60, 77, 61, 46, 91, 96, 117, 35, 84, 92, 101, 69, 46, 27, 48, 109, 63, 77, 53, 61, 50, 74, 95, 114, 50, 89, 103, 73, 93, 103, 35, 108, 34, 64, 51, 95, 52, 97, 55, 96, 104, 96, 92, 86, 83, 51, 58, 33, 33, 65, 82, 48, 32, 108, 94, 100, 97, 34, 92, 80, 67, 60, 34, 114, 70, 52, 101, 80, 29, 48, 101, 35, 119, 86, 107, 44, 108, 94, 111, 39, 38, 81, 33, 111, 60, 75, 40, 100, 62, 55, 81, 51, 41, 76, 50, 77, 106, 105, 76, 50, 52, 80, 110, 101, 59, 39, 60, 67, 79, 31, 44, 28, 26, 71, 104, 99, 51, 34, 85, 92, 47, 110, 81, 69, 36, 64, 123, 114, 42, 125, 57, 94, 65, 41, 38, 32, 84, 80, 119, 51, 97, 61, 86, 112, 96, 78, 64, 69, 66, 90, 97, 93, 53, 60, 117, 84, 77, 100, 97, 94, 97, 45, 97, 33, 63, 32, 98, 91, 95, 107, 111, 89, 101, 84, 54, 81, 35, 36, 112, 74, 72, 64, 74, 81, 78, 47, 105, 57, 114, 75, 48, 36, 38, 34, 121, 76, 30, 51, 84, 116, 53, 33, 103, 96, 54, 98, 46, 88, 59, 100, 111, 79, 61, 70, 105, 97, 46, 99, 118, 39, 118, 62, 71, 31, 33, 35, 67, 77, 52, 55, 78, 88, 108, 34, 60]
b) Plot the number of crimes in a given week against the ice cream sales with a suitable type of plot. Inclue labels for the axes and a title.
import matplotlib.pyplot as plt

plt.scatter(crimes, iceCreamSales, 3)
plt.title("Number of crimes in a given week and the ice cream sales")
plt.xlabel("Crimes")
plt.ylabel("Ice cream sales")
plt.show()
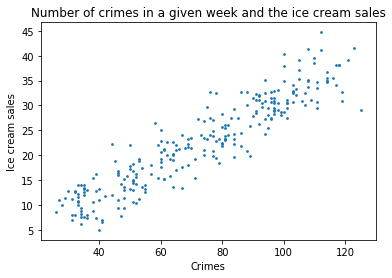
c) Given your plot, do you expect there to be any correlation in the data?
There is clearly a strong correlation in the data. The points follow a straight line pointing upwards pretty closely.
e) Calculate the pearson correlation coefficient between ice cream sales and the number of crimes.
pearsonCoeff = covariance / (crimesStd * iceCreamStd)

print("The pearson correlation coefficient is", round(pearsonCoeff, 5))
The pearson correlation coefficient is 0.92715
f) Discuss what the correlation coefficient says about the data. And if there is a correlation, what are some possible causes? eg. ice cream sales cause crimes. Come up with at least four different explanations. The wikipedia article ”Correlation does not imply causation” touches on some possible conclusions.
The correlation coefficient confirms that there indeed is a strong correlation in the data.
Some possible causes are that ice cream sales cause crimes, that crimes cause ice cream sales, that the correlation is simply random or that a third common causal variable is causing the correlation.